Bid Optimiser
Bid Optimiser
Bid Optimiser
Transforming Bidding : From Spreadsheets to Smart Predictions, Boosting Win Rates and Efficiency
Transforming Bidding : From Spreadsheets to Smart Predictions, Boosting Win Rates and Efficiency
Transforming Bidding : From Spreadsheets to Smart Predictions, Boosting Win Rates and Efficiency
B2B Product Design
Enterprise UX
UX Research
Dashboard Design
Workflow Automation
B2B Product Design
Enterprise UX
UX Research
Dashboard Design
Workflow Automation
Overview
Overview
My role was to digitalise the complex, labor-intensive bidding process in the oilfield services industry. I focused on reimagining workflows that previously required thousands of manual entries and multiple bidding rounds. The innovation lay in introducing AI-driven features , such as smart pricing suggestions, auto-fill ranges, and intelligent discounting, to cut down effort, save time, and improve accuracy.
My role was to digitalise the complex, labor-intensive bidding process in the oilfield services industry. I focused on reimagining workflows that previously required thousands of manual entries and multiple bidding rounds. The innovation lay in introducing AI-driven features , such as smart pricing suggestions, auto-fill ranges, and intelligent discounting, to cut down effort, save time, and improve accuracy.
Duration
Duration
5 months
5 months
Case study sections
Case study sections
I carried out in-depth research on the present model, interacted directly with users, and applied design thinking to build scalable solutions. The process included:
Conducting 10 user interviews to uncover workflows and pain points
Facilitating 1 design thinking workshop with 10 users across 3 GeoUnits (Mexico, Saudi, Asia)
Defining UX patterns, creating style sheets and components, and building layouts
Iterating on feedback through 3 stakeholder review and testing cycles
01 Bid Optimiser Software
01 Bid Optimiser Software
01 Bid Optimiser Software
The existing bidding process was manual, highly repetitive, and prone to errors. Bidders worked on Excel sheets with 2000+ items, which had to be priced and reviewed in just 2–3 days. This created the following problems
The existing bidding process was manual, highly repetitive, and prone to errors. Bidders worked on Excel sheets with 2000+ items, which had to be priced and reviewed in just 2–3 days. This created the following problems
The existing bidding process was manual, highly repetitive, and prone to errors. Bidders worked on Excel sheets with 2000+ items, which had to be priced and reviewed in just 2–3 days. This created the following problems
Problems Identified
Problems Identified
Long Process, Longer time
Long Process, Longer time
Long Process, Longer time
In a time sensitive bidding process the user has to go though a lengthy process to arrive at estimates.
In a time sensitive bidding process the user has to go though a lengthy process to arrive at estimates.
Cognitive overload
Cognitive overload
Cognitive overload
Too much information with no prioritization, making it hard to focus on critical data.
Too much information with no prioritization, making it hard to focus on critical data.
Labor-intensive tasks
Labor-intensive tasks
Labor-intensive tasks
Applying formulas, manually calculating estimates, and saving in multiple formats consumed enormous man hours.
Applying formulas, manually calculating estimates, and saving in multiple formats consumed enormous man hours.
No Supporting Matrix
No Supporting Matrix
No Supporting Matrix
No insights or supporting matrix to help in decision making
No insights or supporting matrix to help in decision making
Poor documentation
Poor documentation
Poor documentation
Processes were scattered across offline files or different apps, limiting traceability.
Processes were scattered across offline files or different apps, limiting traceability.
No Clear Scope
No Clear Scope
No Clear Scope
The scope of the feature was not defined, lot new requirements kept coming up in the later stages.
The scope of the feature was not defined, lot new requirements kept coming up in the later stages.
Problems Identified
Win rates dropped
Win rates dropped
77%
77%
55%
55%
2023 - 2024
2023 - 2024
2023 - 2024
2024 - 2025
2024 - 2025
2024 - 2025
With AI and digitalisation reshaping the industry, SLB needed to modernise its approach to stay competitive.
With AI and digitalisation reshaping the industry, SLB needed to modernise its approach to stay competitive.
With AI and digitalisation reshaping the industry, SLB needed to modernise its approach to stay competitive.
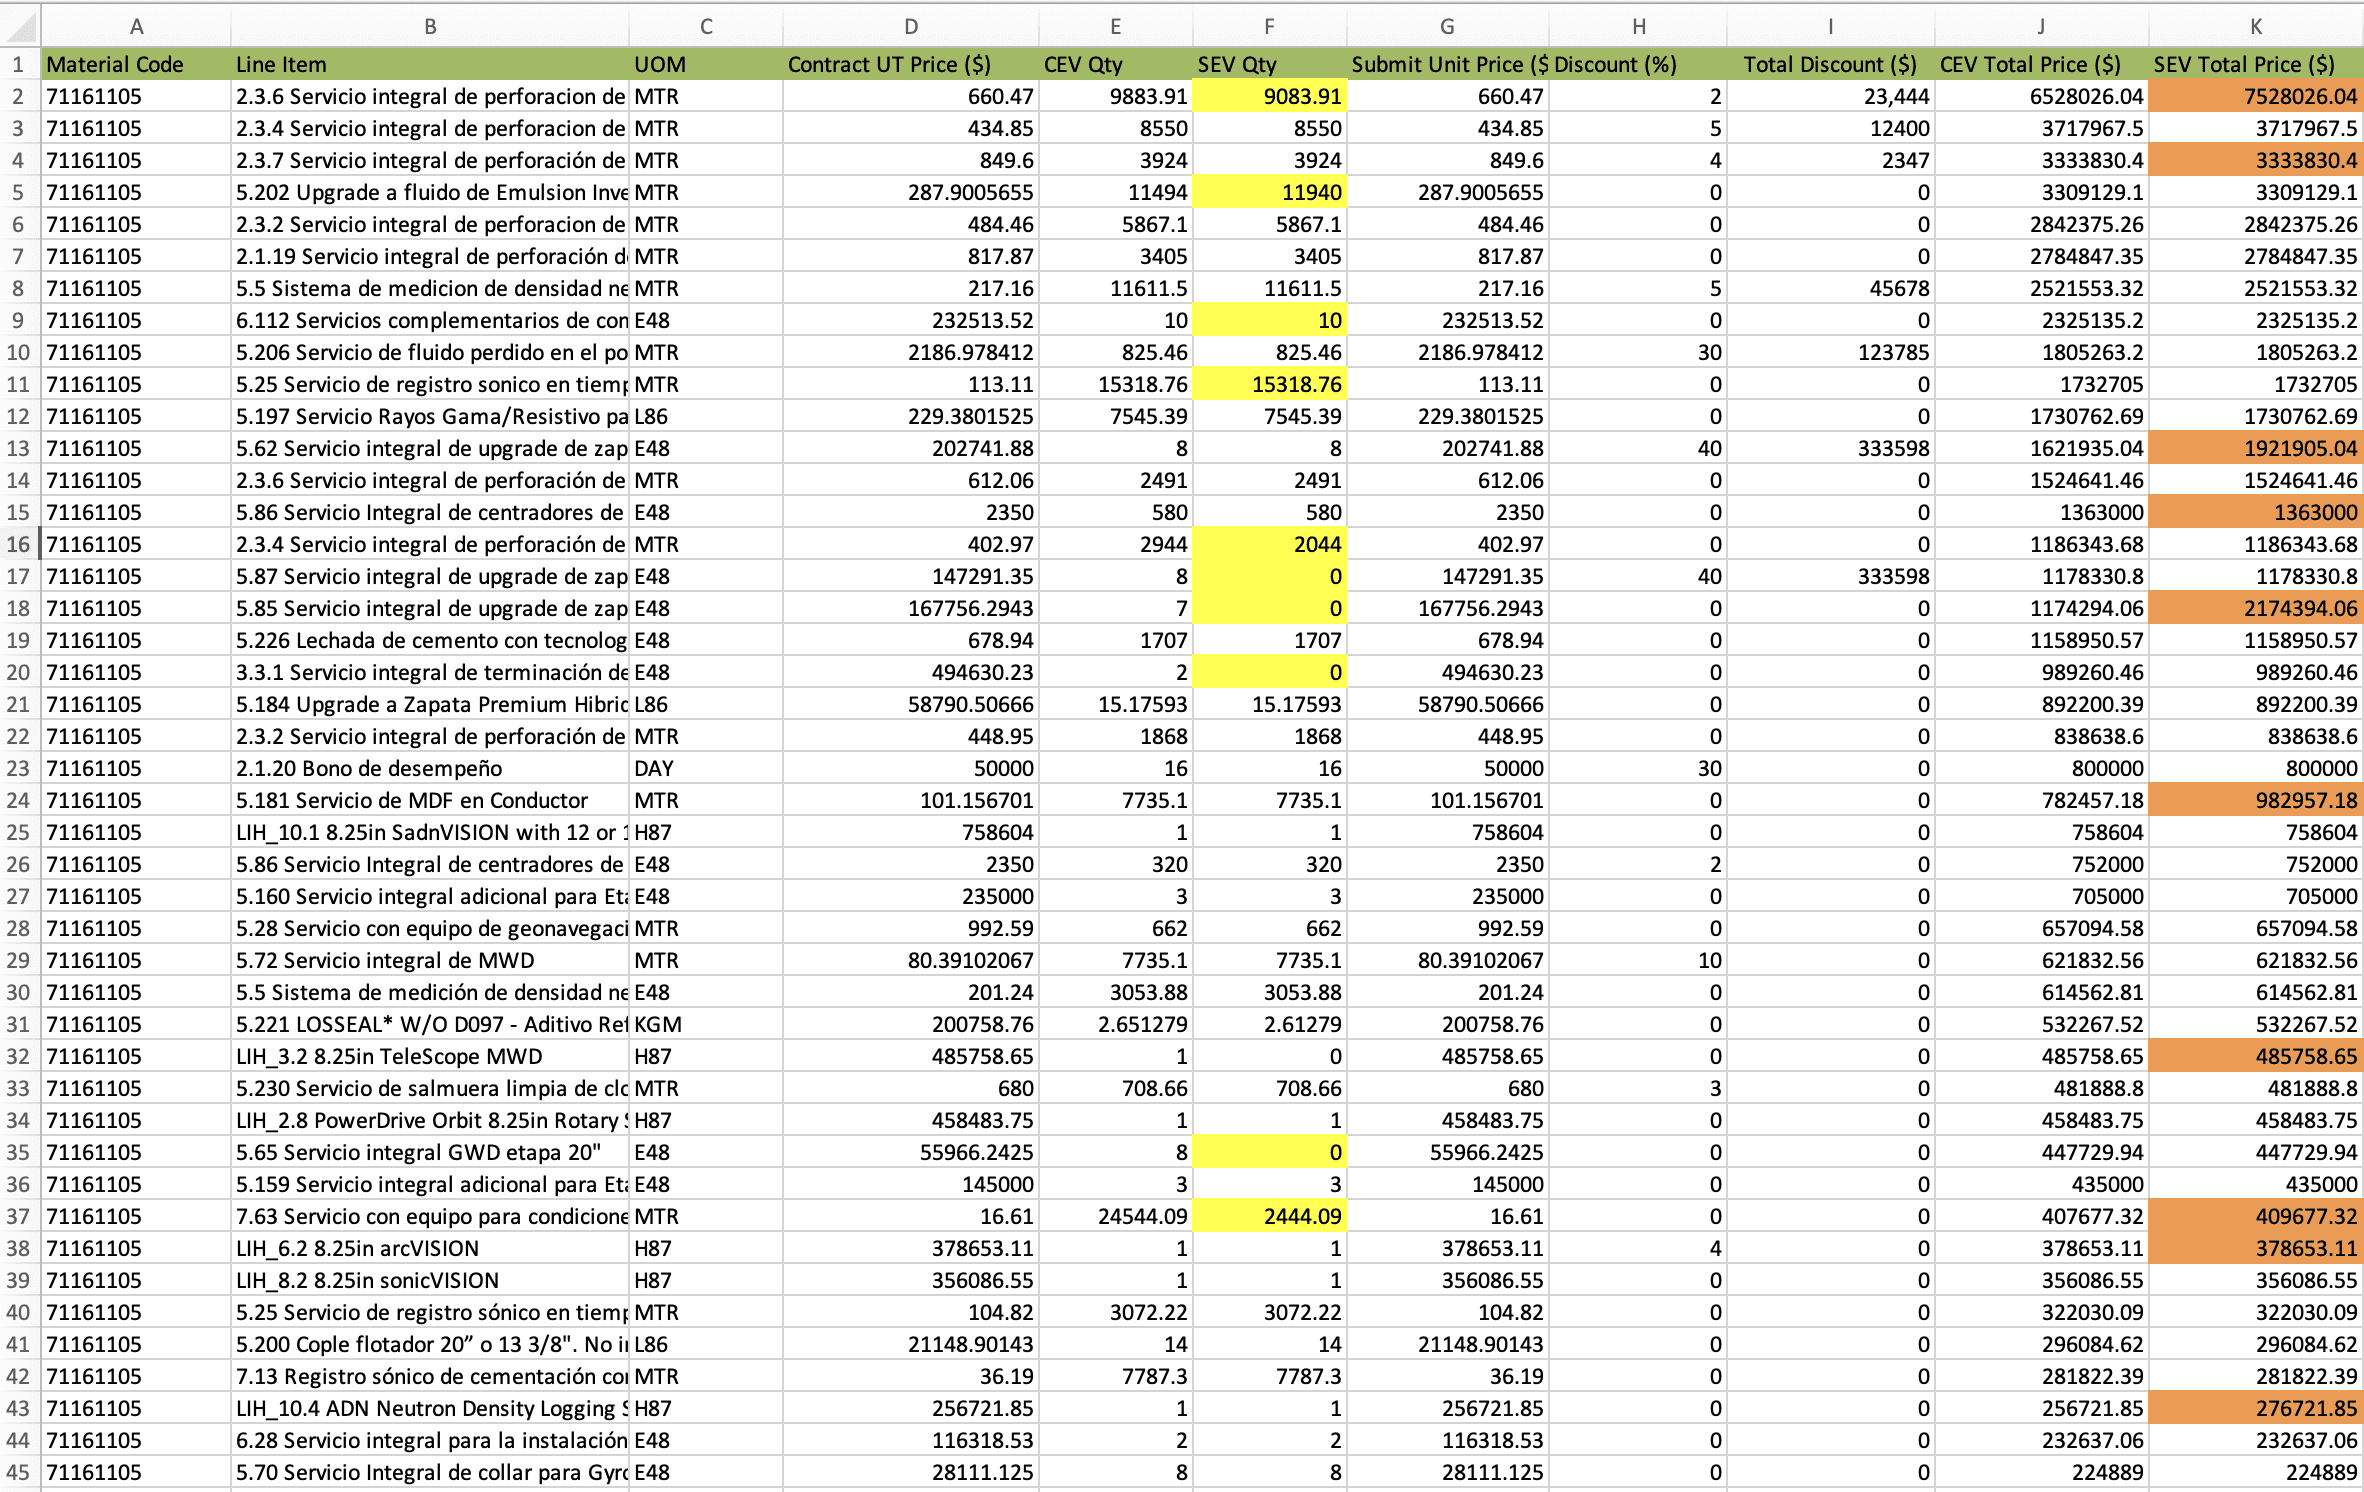
Image 1.2 Current Bidding Sheet
Image 1.2 Current Bidding Sheet
Image 1.2 Current Bidding Sheet
02 Research
02 Research
02 Research
2.1 Understand the user journey
2.1 Understand the user journey
2.1 Understand the user journey
with an analogy
with an analogy
1
Client X wants to build a home
2
1
New home to be constructed
Client X wants to build a home
2
New home to be constructed
3
Client X gives out a list of items that he think will be used
Client X gives out a list of items that he think will be used
4
Like all the items that might be used in making of the house : Bricks, cement. wood etc..
Like all the items that might be used in making of the house : Bricks, cement. wood etc..
5
Next they release the list to bidders like SLB, Halliburton Company and others.
Next they release the list to bidders like SLB, Halliburton Company and others.
6
SLB reviews all the requirements
SLB reviews all the requirements
7
SLB checks if it had build similar houses to to get an estimates
SLB checks if it had build similar houses to to get an estimates
8
SLB refers the items used in each house of these houses.
SLB refers the items used in each house of these houses.
9
And makes a new list of items required for construction of the house.
And makes a new list of items required for construction of the house.
10
Checks and compares with client X list.
Checks and compares with client X list.
11
Client X always gives more than what is required. Ex : special kind of bolts
Client X always gives more than what is required. Ex : special kind of bolts
12
But SLB knows that we wont be needing the special bolts.
But SLB knows that we wont be needing the special bolts.
13
So SLB decides to give big discounts on the special bolts
So SLB decides to give big discounts on the special bolts
14
So that we give the lowest bid along all competitors.
So that we give the lowest bid along all competitors.
15
SLB submits the round 1 estimates, and waits.
SLB submits the round 1 estimates, and waits.
16
Client X reviews all bid prices submitted by everyone.
Client X reviews all bid prices submitted by everyone.
17
Client releases a new revised list of items and their prices.
Client releases a new revised list of items and their prices.
18
This process continues for 7 rounds and the lowest bidder wins the contract
This process continues for 7 rounds and the lowest bidder wins the contract
Assessing the needs and pain points
Assessing the needs and pain points
From talking to the marketing team across multiple geounits
From talking to the marketing team across multiple geounits
Challenges & Pain Points
Challenges & Pain Points
“Hectic process, if we had something that could pull quick estimates, it will save us so much time.”
“Referring to historical well data from BPI, downloading it into Excel, and then editing is extremely time-taking.”
We use SLB OneDrive to store bid progress, but only the final winning round data gets saved into the main BPI system
“I want to easily compare different price options to see which one fits the best.”
“An Excel sheet with 2000–3000 items filled with prices, discounts, and units looks very cluttered and hard to understand.”
“We’re unable to properly track the progress from round 1 to round 7.”
“Collaborating with my marketing teammates over email trails and Teams makes the process messy”
Ideas and Feedback
Ideas and Feedback
“I want to get quick estimates in minutes, based on historical bidding data and well details.”
“I’d like to do all the actions in the app, but still be able to download everything in Excel format for special cases.”
“I need strong flagging with colours so I can easily compare, mark, and track important numbers.”
“It would be great if the system could apply discounts smartly and even suggest prices for me, almost like AI.”
“I want the ability to create multiple scenarios, like different discount strategies or item groupings, and compare them side by side.”
“I need to add multiple rounds and be able to compare them, so I can clearly see the progress from round 1 to the final round.”
“This whole process is so lengthy and data-heavy, I wish it could be broken into smaller steps that are easier to complete.”
“The UI should feel clutter-free and easy to read, with the most important info visible at a glance.”
A holistic approach to Bid Optimiser
A holistic approach to Bid Optimiser
All the key flows and the key features which needed to be in the solution
All the key flows and the key features which needed to be in the solution
Create New Scenario
Create New Scenario
Select reference wells to build scenarios.
Create different baskets to test multiple pricing combinations.
Edit for special cases where manual adjustments are needed.
Select reference wells to build scenarios.
Create different baskets to test multiple pricing combinations.
Edit for special cases where manual adjustments are needed.
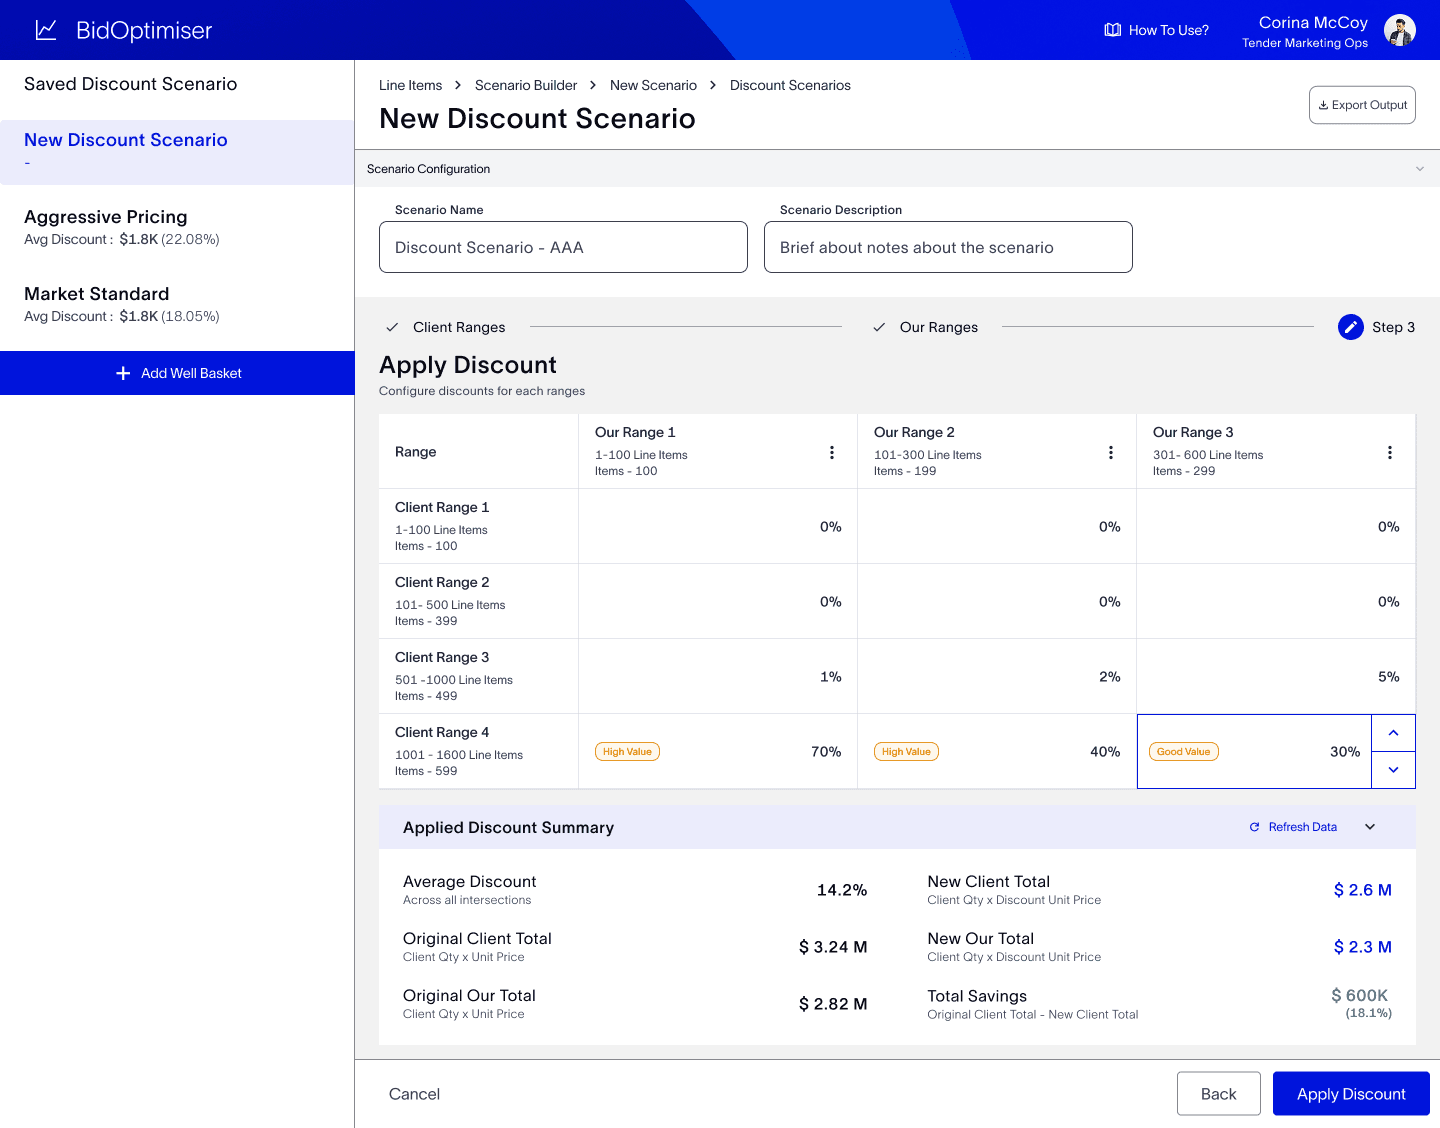
Discount Scenario
Discount Scenario
Create ranges for company and client quantities.
Apply discounts across the matrix to test outcomes.
Get smart suggestions from the system on which discounts optimize profits.
See win predictions based on the discounts applied.
Create ranges for company and client quantities.
Apply discounts across the matrix to test outcomes.
Get smart suggestions from the system on which discounts optimize profits.
See win predictions based on the discounts applied.
Scenario Dashboard
Scenario Dashboard
View and manage multiple bidding rounds in one place.
Download the entire table in Excel format for offline edits.
Perform key actions such as Compare, Apply Discounts, and Smart Pricing.
Use sort, filter, and search functions across all columns.
Enable colour coding for better visual clarity.
Directly edit cells within the dashboard for quick adjustments.
Smart Unit Price Scenarios
Smart Unit Price Scenarios
Set rules and targets for generating smart prices.
Create multiple sets of rules to compare different smart price outputs.
Show before-and-after impact of applying smart prices to build user confidence.
Set rules and targets for generating smart prices.
Create multiple sets of rules to compare different smart price outputs.
Show before-and-after impact of applying smart prices to build user confidence.
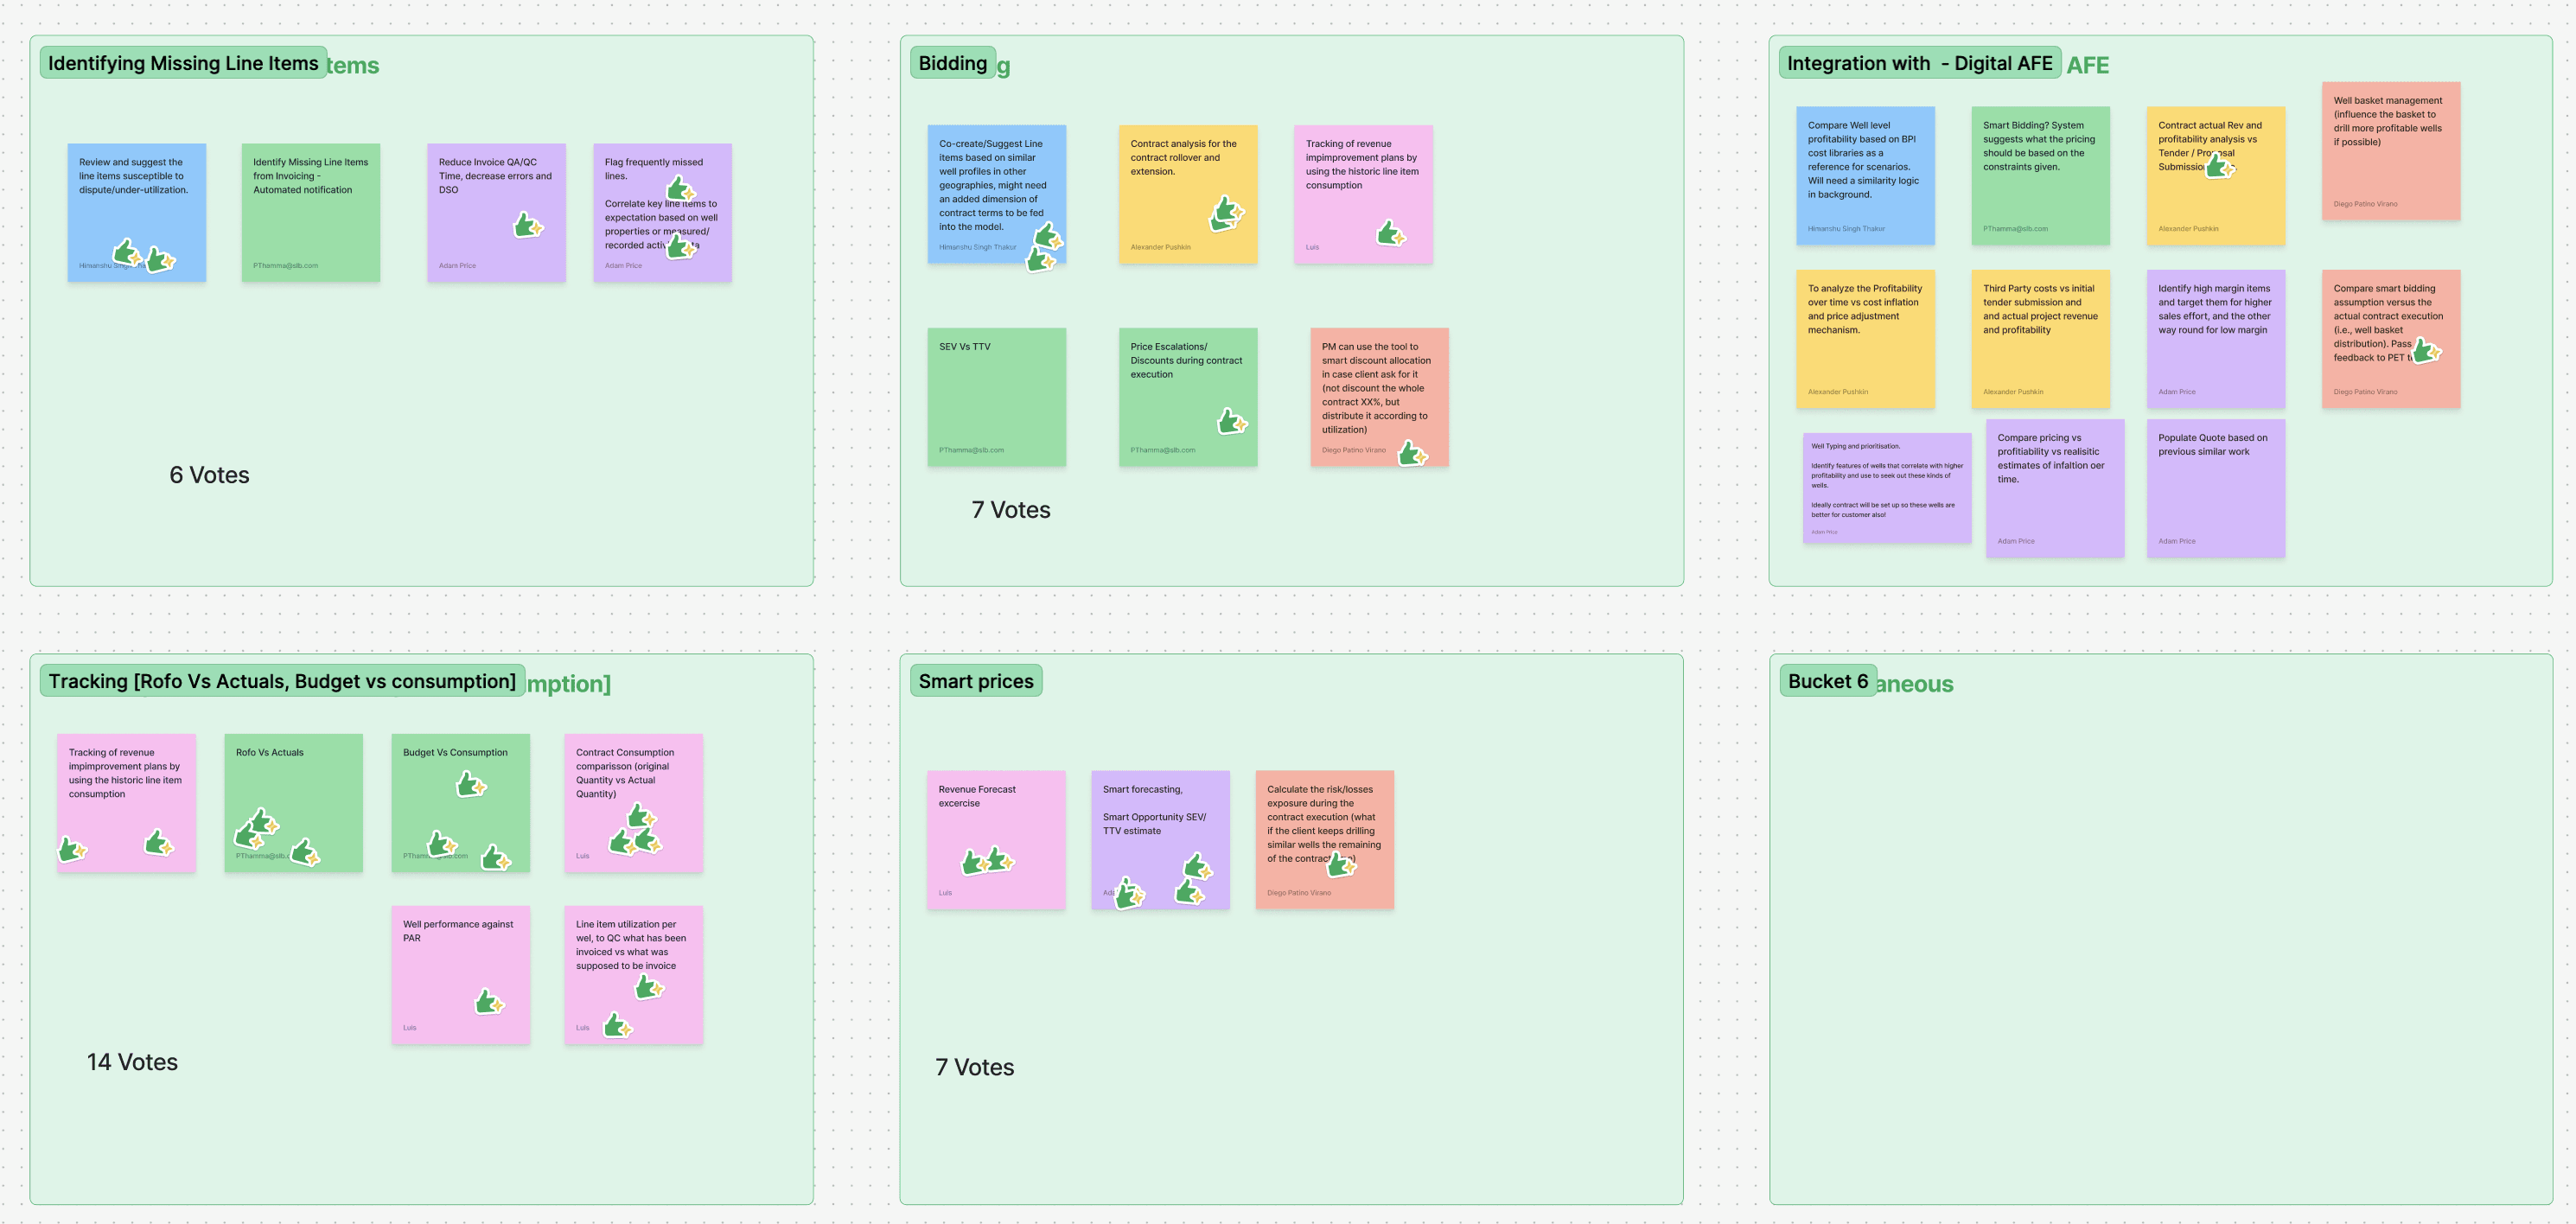
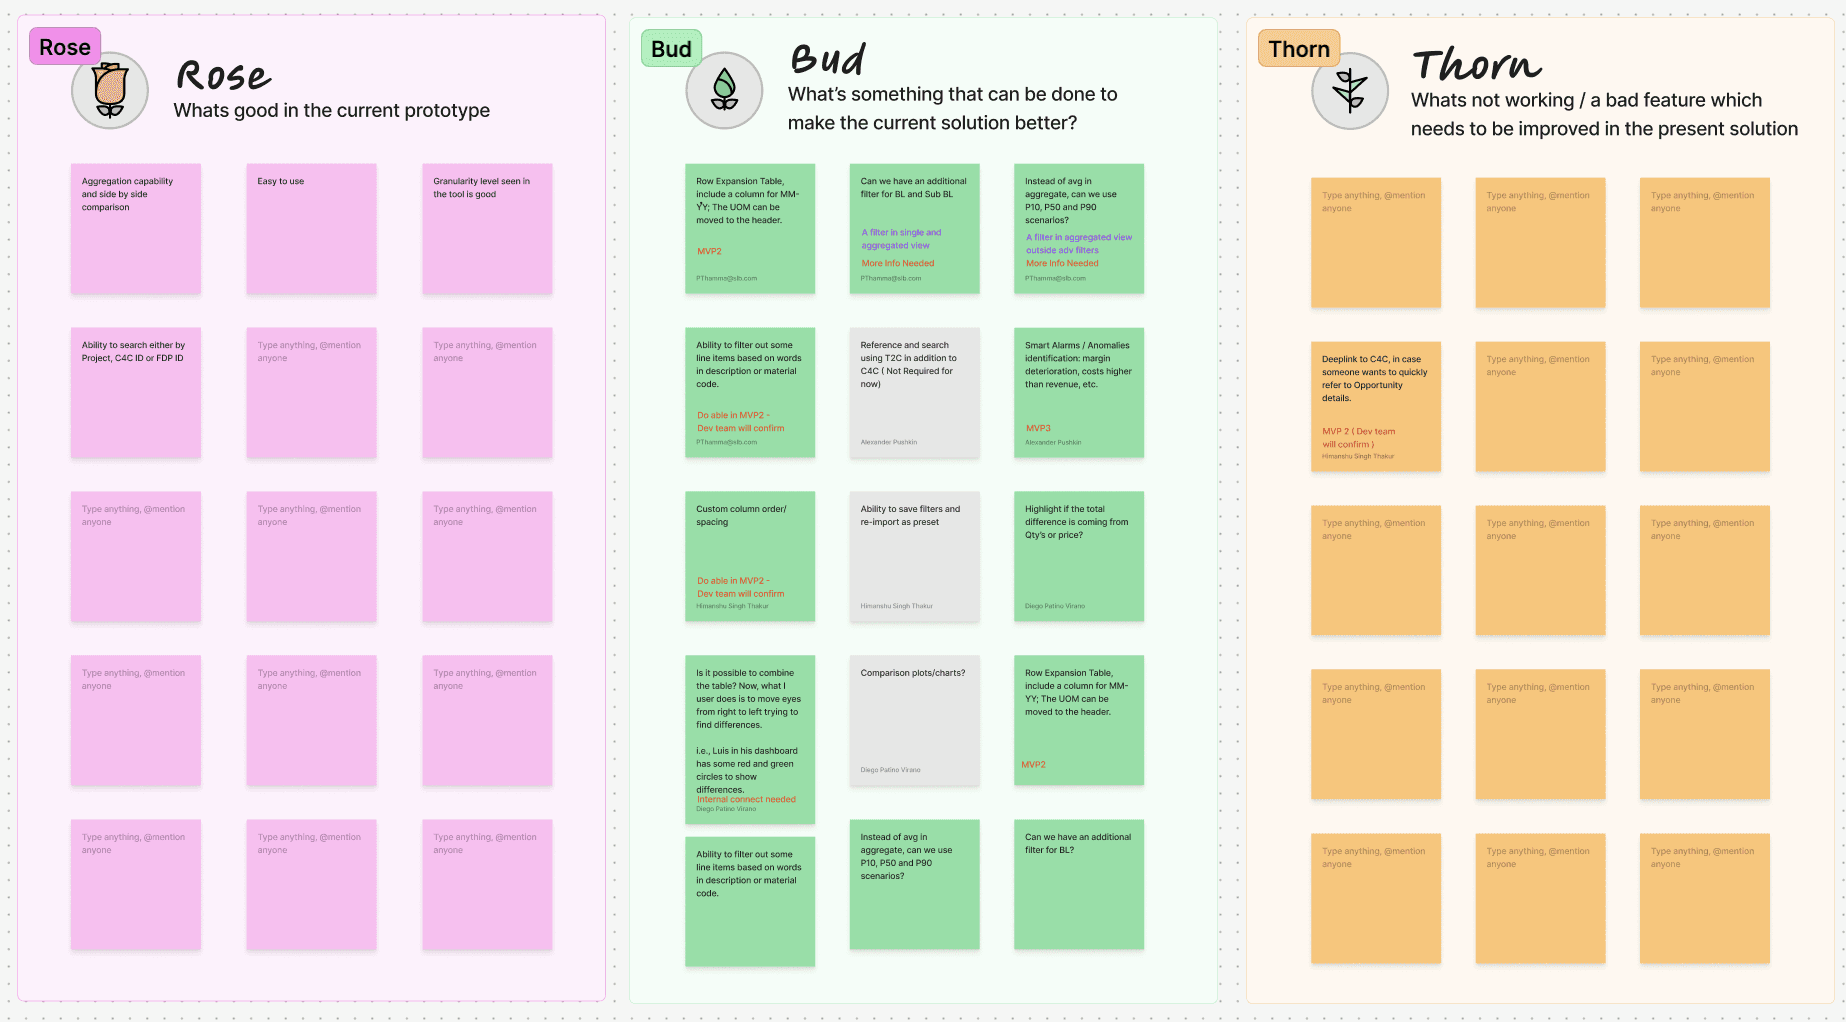
Image 2.1 : Outcomes of the design thinking sessions
Image 2.1 : Outcomes of the design thinking sessions
2.3 Information Architecture
2.3 Information Architecture
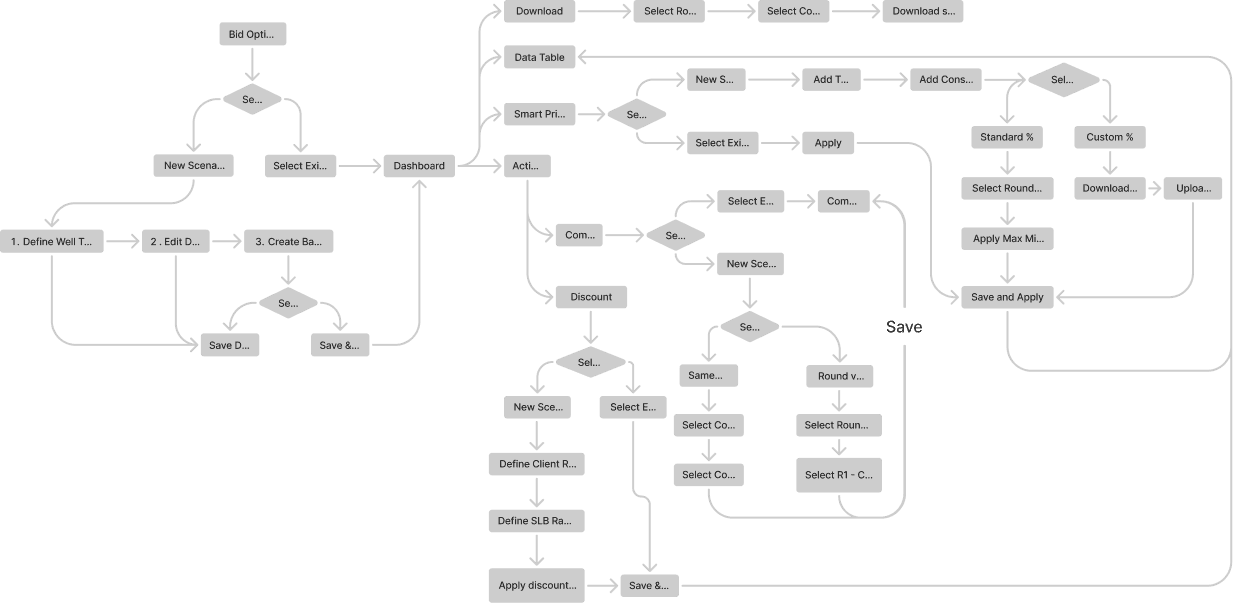
Image 2.3 High level information Architecture
Image 2.3 High level information Architecture
Image 2.3 High level information Architecture
03 Solution
03 Solution
03 Solution
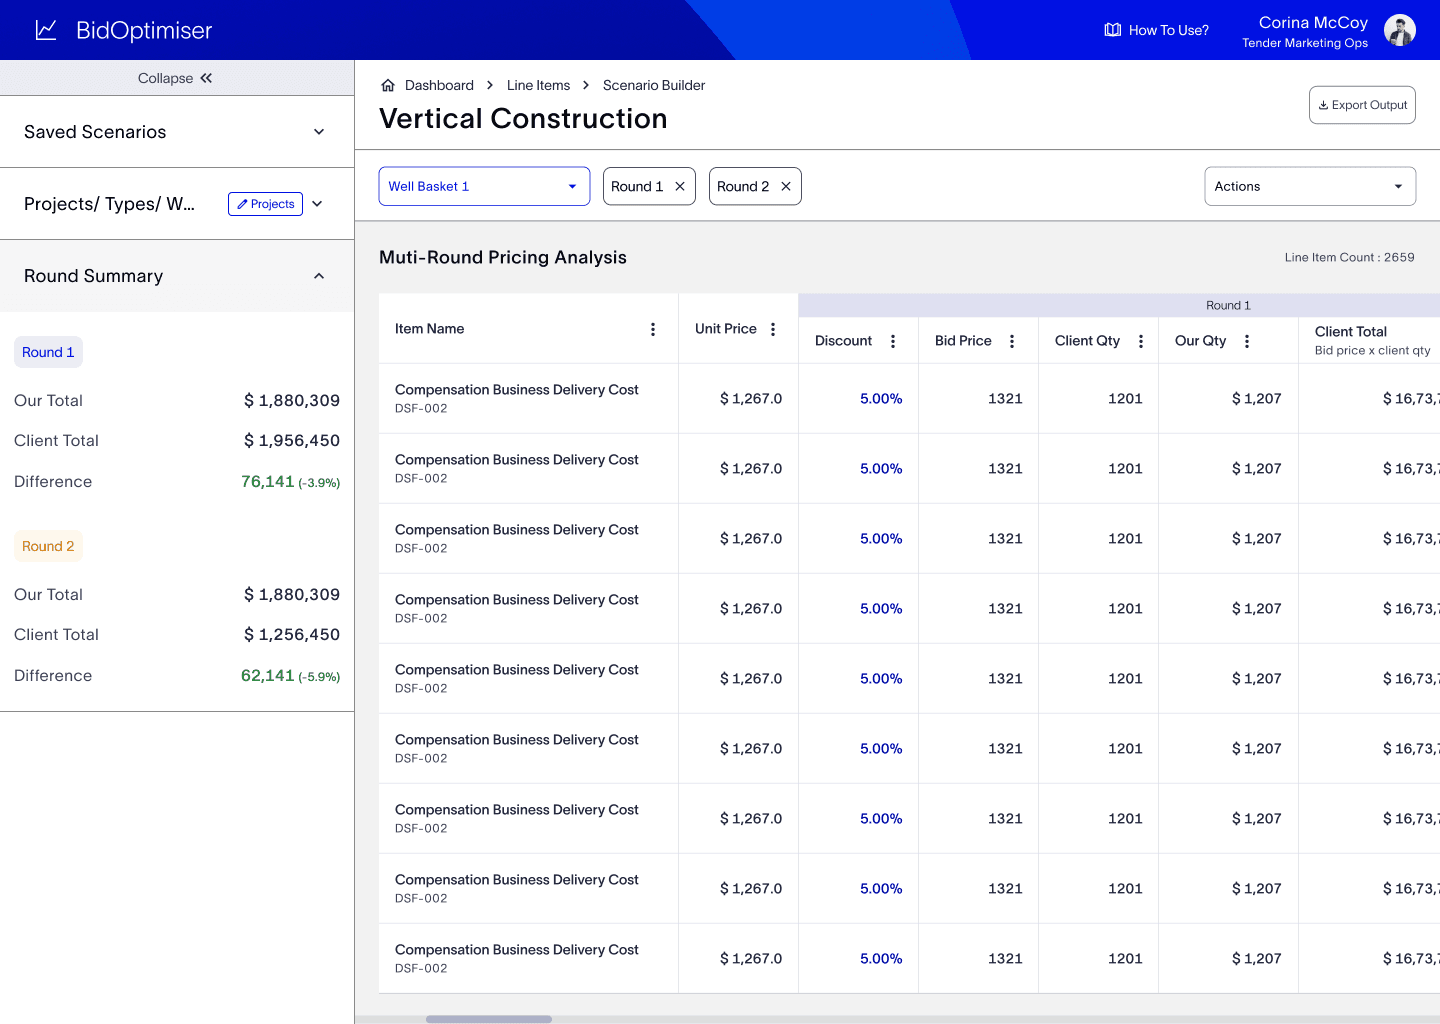
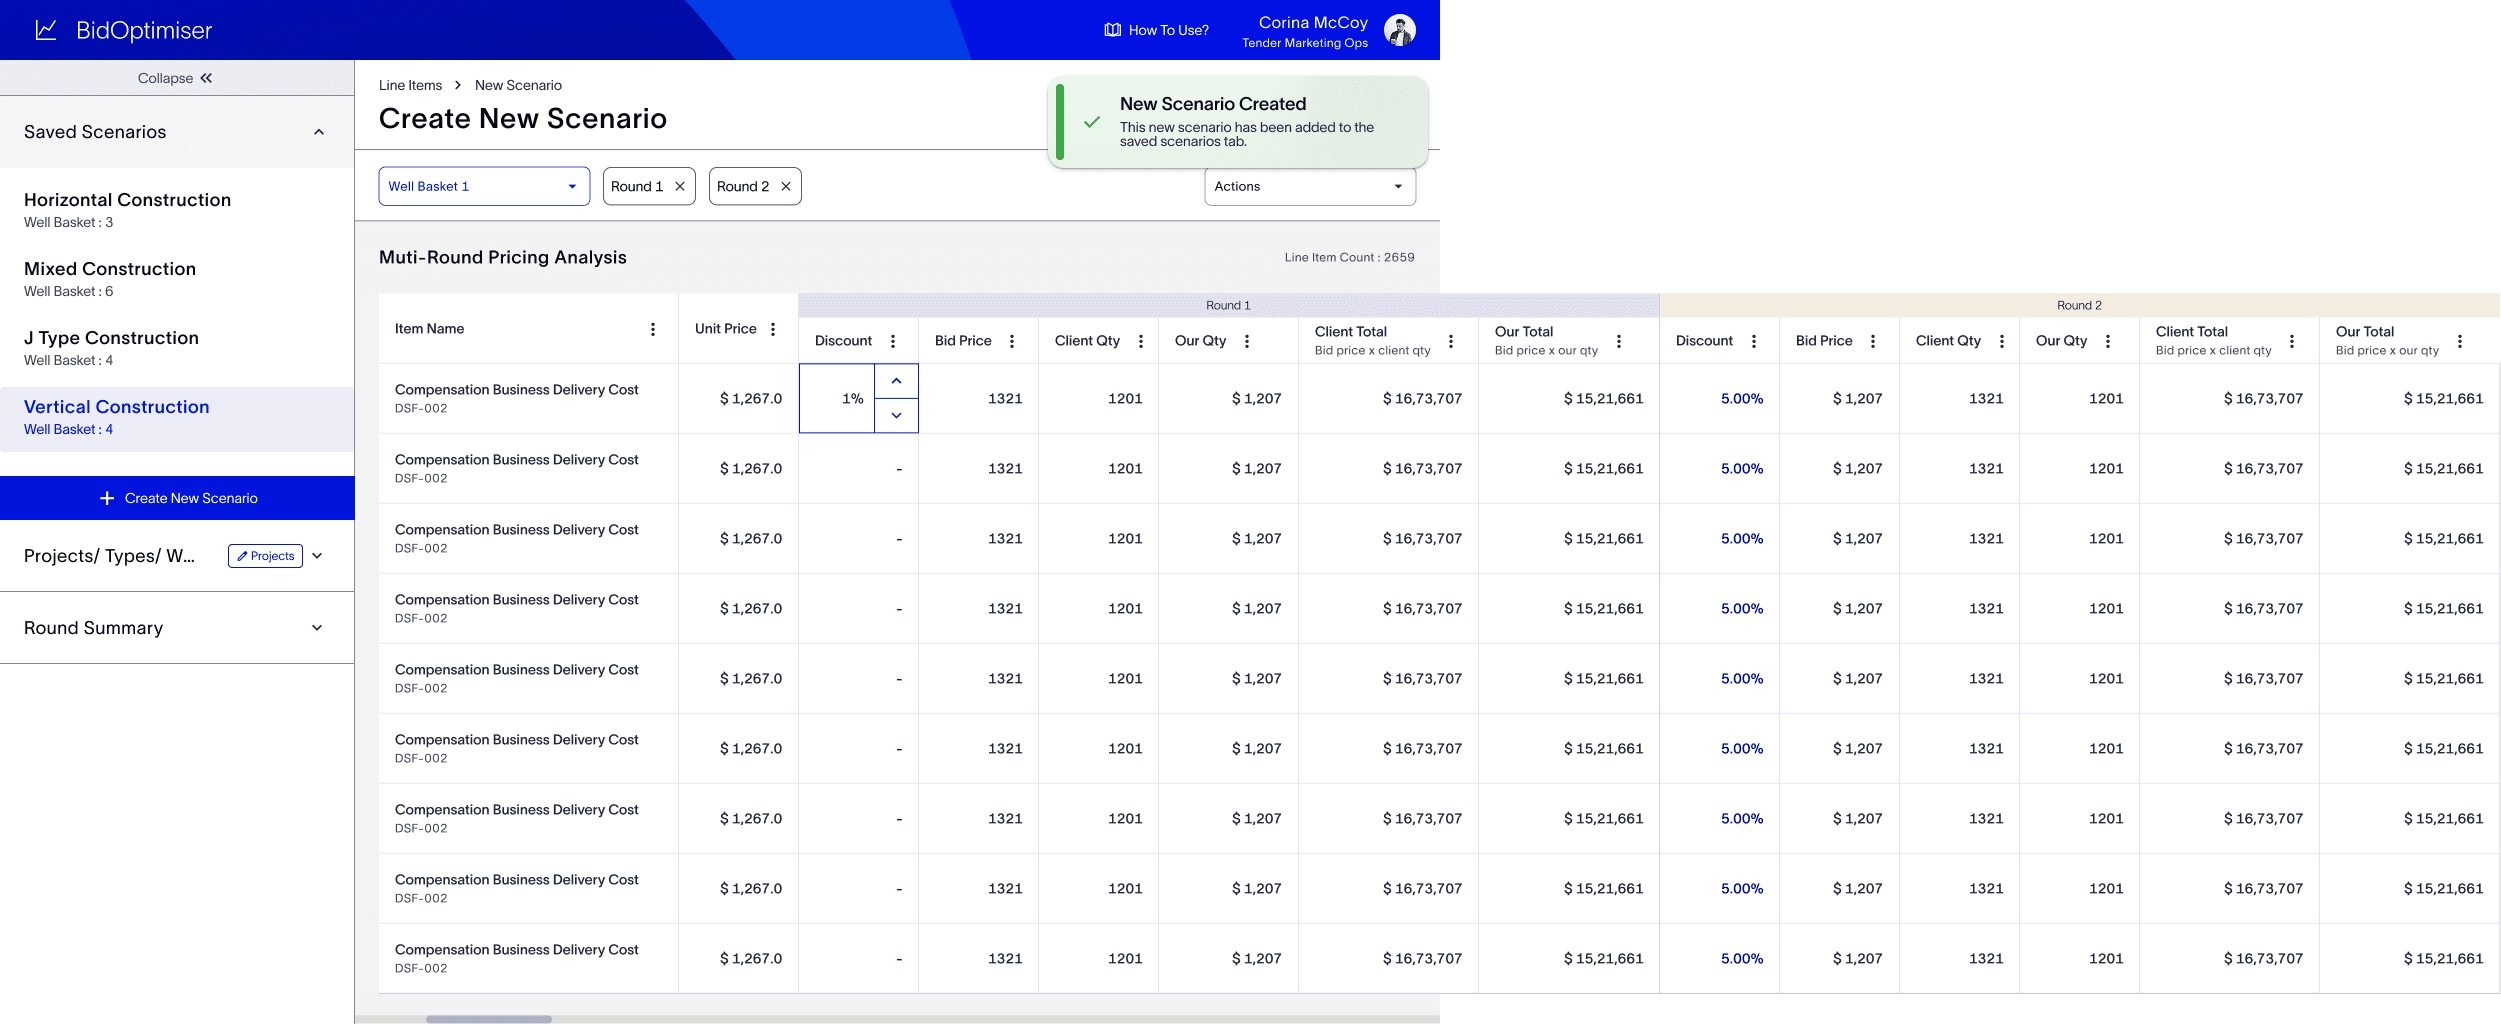
3.1 Scenario Dashboard
3.1 Scenario Dashboard
3.1 Scenario Dashboard
The Scenario Dashboard is the central workspace where users can perform multiple actions to arrive at the best possible prices across bidding round
The Scenario Dashboard is the central workspace where users can perform multiple actions to arrive at the best possible prices across bidding round
Why This Design?
Why This Design?
Since users were already comfortable working in Excel, I designed the dashboard in a familiar tabular format. This minimised the learning curve and encouraged quick adoption while still enabling advanced features that Excel could not provide.
Since users were already comfortable working in Excel, I designed the dashboard in a familiar tabular format. This minimised the learning curve and encouraged quick adoption while still enabling advanced features that Excel could not provide.
Key Features
Key Features
Decision Support Metrics
Sticky panels on the left display key totals, win predictions, and comparison matrices. These act as a quick reference for decision-making, can accommodate future if new metrics are required..
Decision Support Metrics
Sticky panels on the left display key totals, win predictions, and comparison matrices. These act as a quick reference for decision-making, can accommodate future if new metrics are required..
Search, Sort, and Filter
Advanced controls on each column make it easy to navigate large datasets of items.
Search, Sort, and Filter
Advanced controls on each column make it easy to navigate large datasets of items.
Inline Actions
Within the table, users can apply discounts, compare scenarios, and test smart pricing.
Inline Actions
Within the table, users can apply discounts, compare scenarios, and test smart pricing.
Multi-Round Analysis
A tabular view allows users to compare pricing across different bidding rounds side by side.
Multi-Round Analysis
A tabular view allows users to compare pricing across different bidding rounds side by side.
Excel Integration
Users can download the entire dataset in Excel format, supporting their existing workflows for special cases.
Excel Integration
Users can download the entire dataset in Excel format, supporting their existing workflows for special cases.
Saved Scenarios
A left panel shows all saved scenarios, making it easy to switch between drafts, current, and past versions.
3.2 Action Form
3.2 Action Form
3.2 Action Form
The Actions Screen is where users apply advanced functions such as discounting, comparing, and smart pricing.
The Actions Screen is where users apply advanced functions such as discounting, comparing, and smart pricing.
Why This Design?
Why This Design?
Since these actions often required filling long and complex forms, I broke them into smaller, guided steps using a stepper at the top. This approach reduces cognitive load and helps users understand where they are in the process.
Since these actions often required filling long and complex forms, I broke them into smaller, guided steps using a stepper at the top. This approach reduces cognitive load and helps users understand where they are in the process.
Since these actions often required filling long and complex forms, I broke them into smaller, guided steps using a stepper at the top. This approach reduces cognitive load and helps users understand where they are in the process.
Key Features
Key Features
Reusability
By standardizing the process, users can easily reapply or tweak actions without starting from scratch.
Step-by-Step Flow
Each action (discounting, comparing, smart pricing) is broken down into sequential steps with a clear stepper header. This improves usability and reduces the chances of errors.
Smart Fill (AI Assistance):
I integrated AI-powered smart fill options wherever they could significantly cut down user effort — such as defining ranges, applying discounts, or naming scenarios. The system uses historical bidding and well data to auto-suggest values, helping users complete configurations in minutes instead of hours.
Saved Actions Panel
A left-hand panel (similar to the Scenario Dashboard) allows users to quickly select previously saved actions and reapply them, saving time in repetitive bidding situations.
Consistency Across Actions
All action screens follow a standardized layout — with the same placement of save/apply buttons and a left panel for saved actions. This consistency builds familiarity and confidence in the workflow.
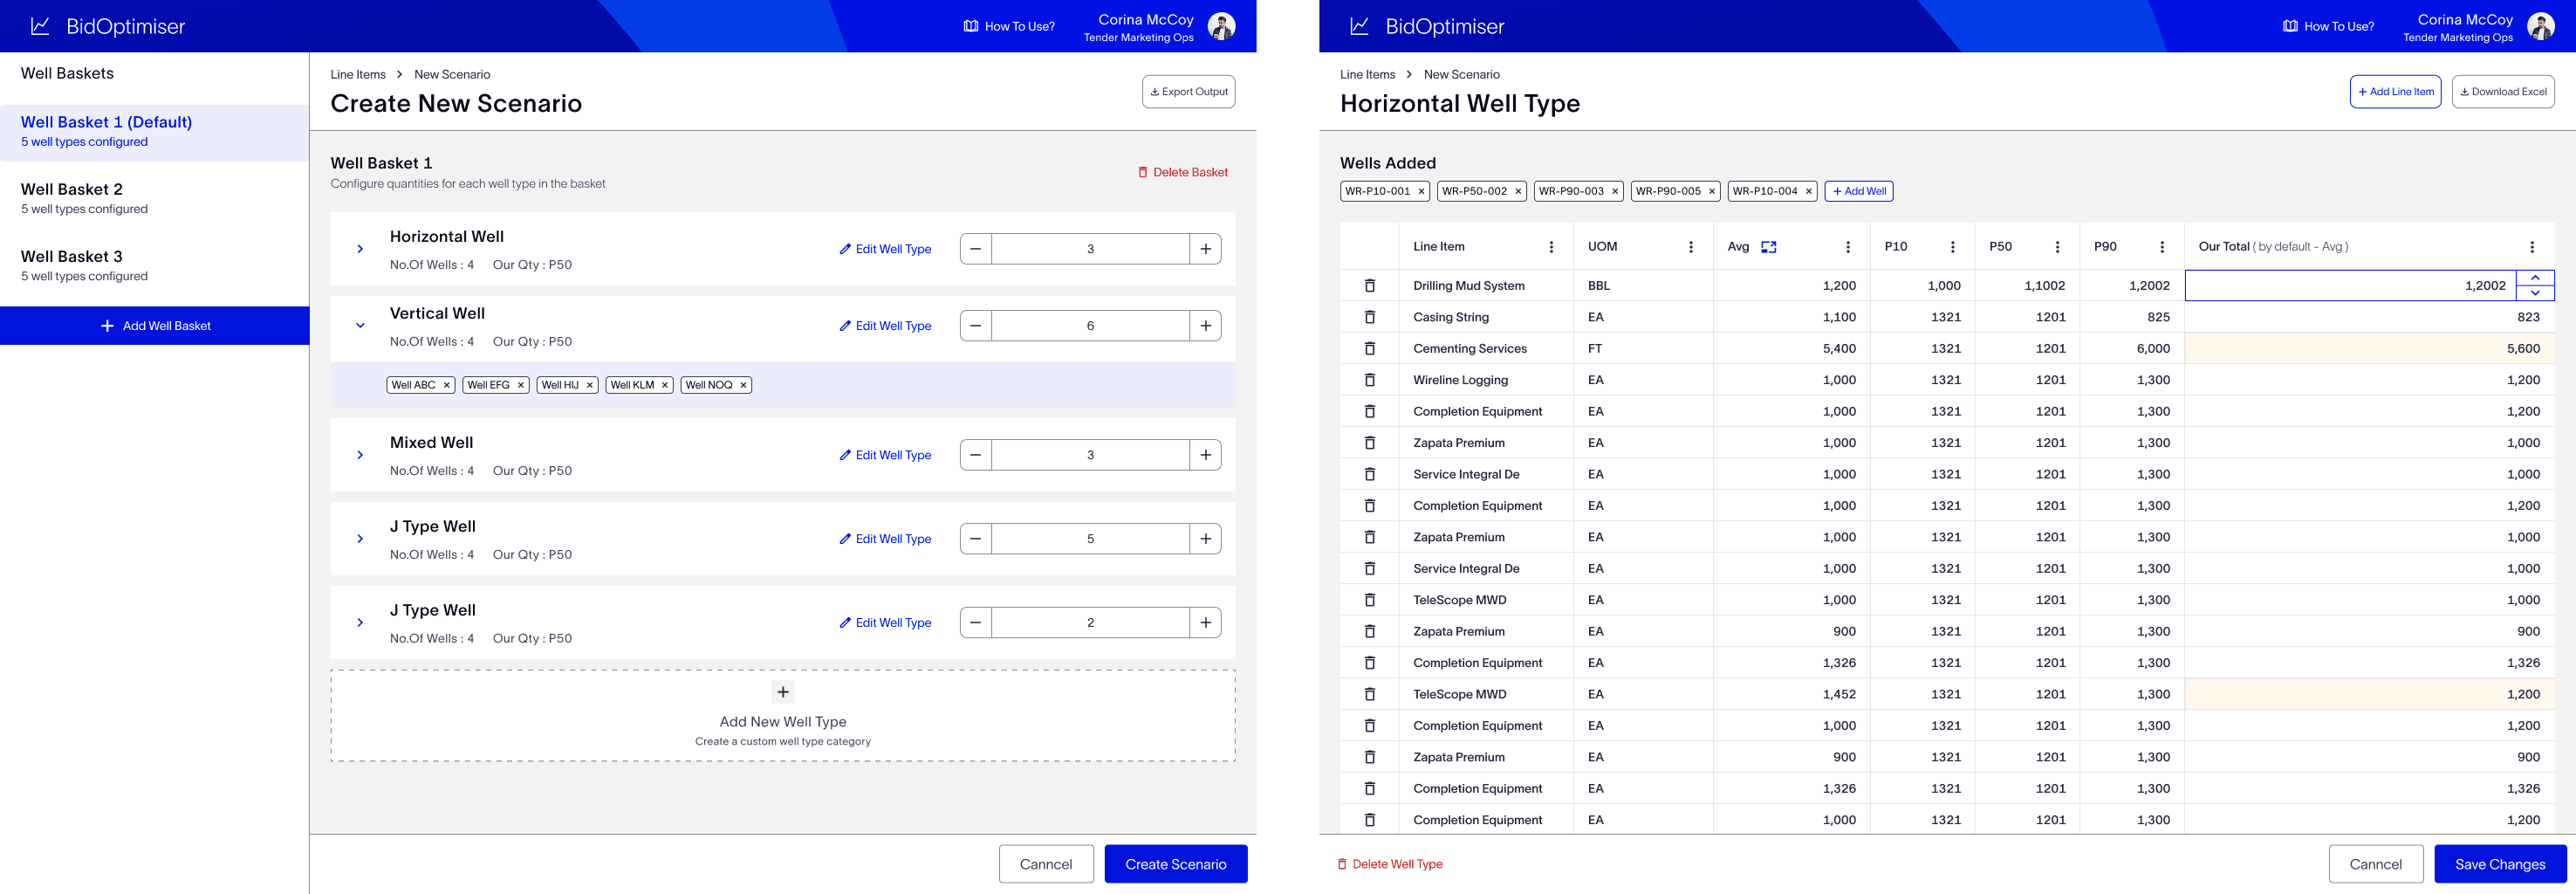
3.3 Create New Scenario
3.3 Create New Scenario
3.3 Create New Scenario
The Create New Scenario flow was designed to replicate the users’ natural bidding workflow while removing the friction points of manual Excel-based methods. Through user interviews, it became clear that the bidding process always begins with referencing historical wells, adjusting quantities, and grouping them into comparison baskets. I translated this into a guided 3-step digital flow, ensuring familiarity, structure, and efficiency.
Edit Table
Review fetched historical data and refine client quantities.
Design Considerations:
Combined client input + historical average in the same row for easy comparison.
Editable cells with real-time recalculation let users tweak without leaving the context.
Flagging changed rows (visual highlights) provides immediate visibility into where edits differ from historical averages, a subtle way to build trust.
Familiar tabular view ensures easy transition for Excel-heavy users.
Create a Basket
Create multiple pricing strategies
Design Considerations:
Users can create multiple baskets with variations in quantities, enabling what-if analysis.
Side-by-side comparison helps evaluate which basket leads to the most competitive pricing.
Clear action CTA “Create Scenario” closes the loop and sets up the foundation for scenario analysis.
This reduces back-and-forth with Excel, cutting down effort by nearly 50%.
04 User Testing and Iterations
04 User Testing and Iterations
04 User Testing and Iterations
3 Rounds Of Testing
3 Rounds Of Testing
3 Rounds Of Testing
with active bidders / marketing team
with active bidders / marketing team
Simplify redundant steps and align terminology with user jargon
Simplify redundant steps and align terminology with user jargon
Add loader animations and instant feedback to reduce uncertainty
Add loader animations and instant feedback to reduce uncertainty
Improve the naming of columns for faster comprehension
Improve the naming of columns for faster comprehension
05 Results
05 Results
05 Results
40% Reduction In Time
40% Reduction In Time
The bidding turn over time have been reduced to 40%
The bidding turn over time have been reduced to 40%
200 + Projects
200 + Projects
Data will be processed in this application (P/WT/W/S)
Data will be processed in this application (P/WT/W/S)
AI Features
AI Features
One of first apps in studio to adapt AI features.
One of first apps in studio to adapt AI features.
The Bid Optimiser rapidly gained traction across SLB, partly due to strong backing from leadership and partly because it directly addressed the most pressing user pain points. What started as a tool for simplifying tables evolved into a strategic advantage that turned raw data into actionable insights.
The Bid Optimiser rapidly gained traction across SLB, partly due to strong backing from leadership and partly because it directly addressed the most pressing user pain points. What started as a tool for simplifying tables evolved into a strategic advantage that turned raw data into actionable insights.
Thank you for watching 🙌🏼
Thank you for watching 🙌🏼
Thank you for watching 🙌🏼